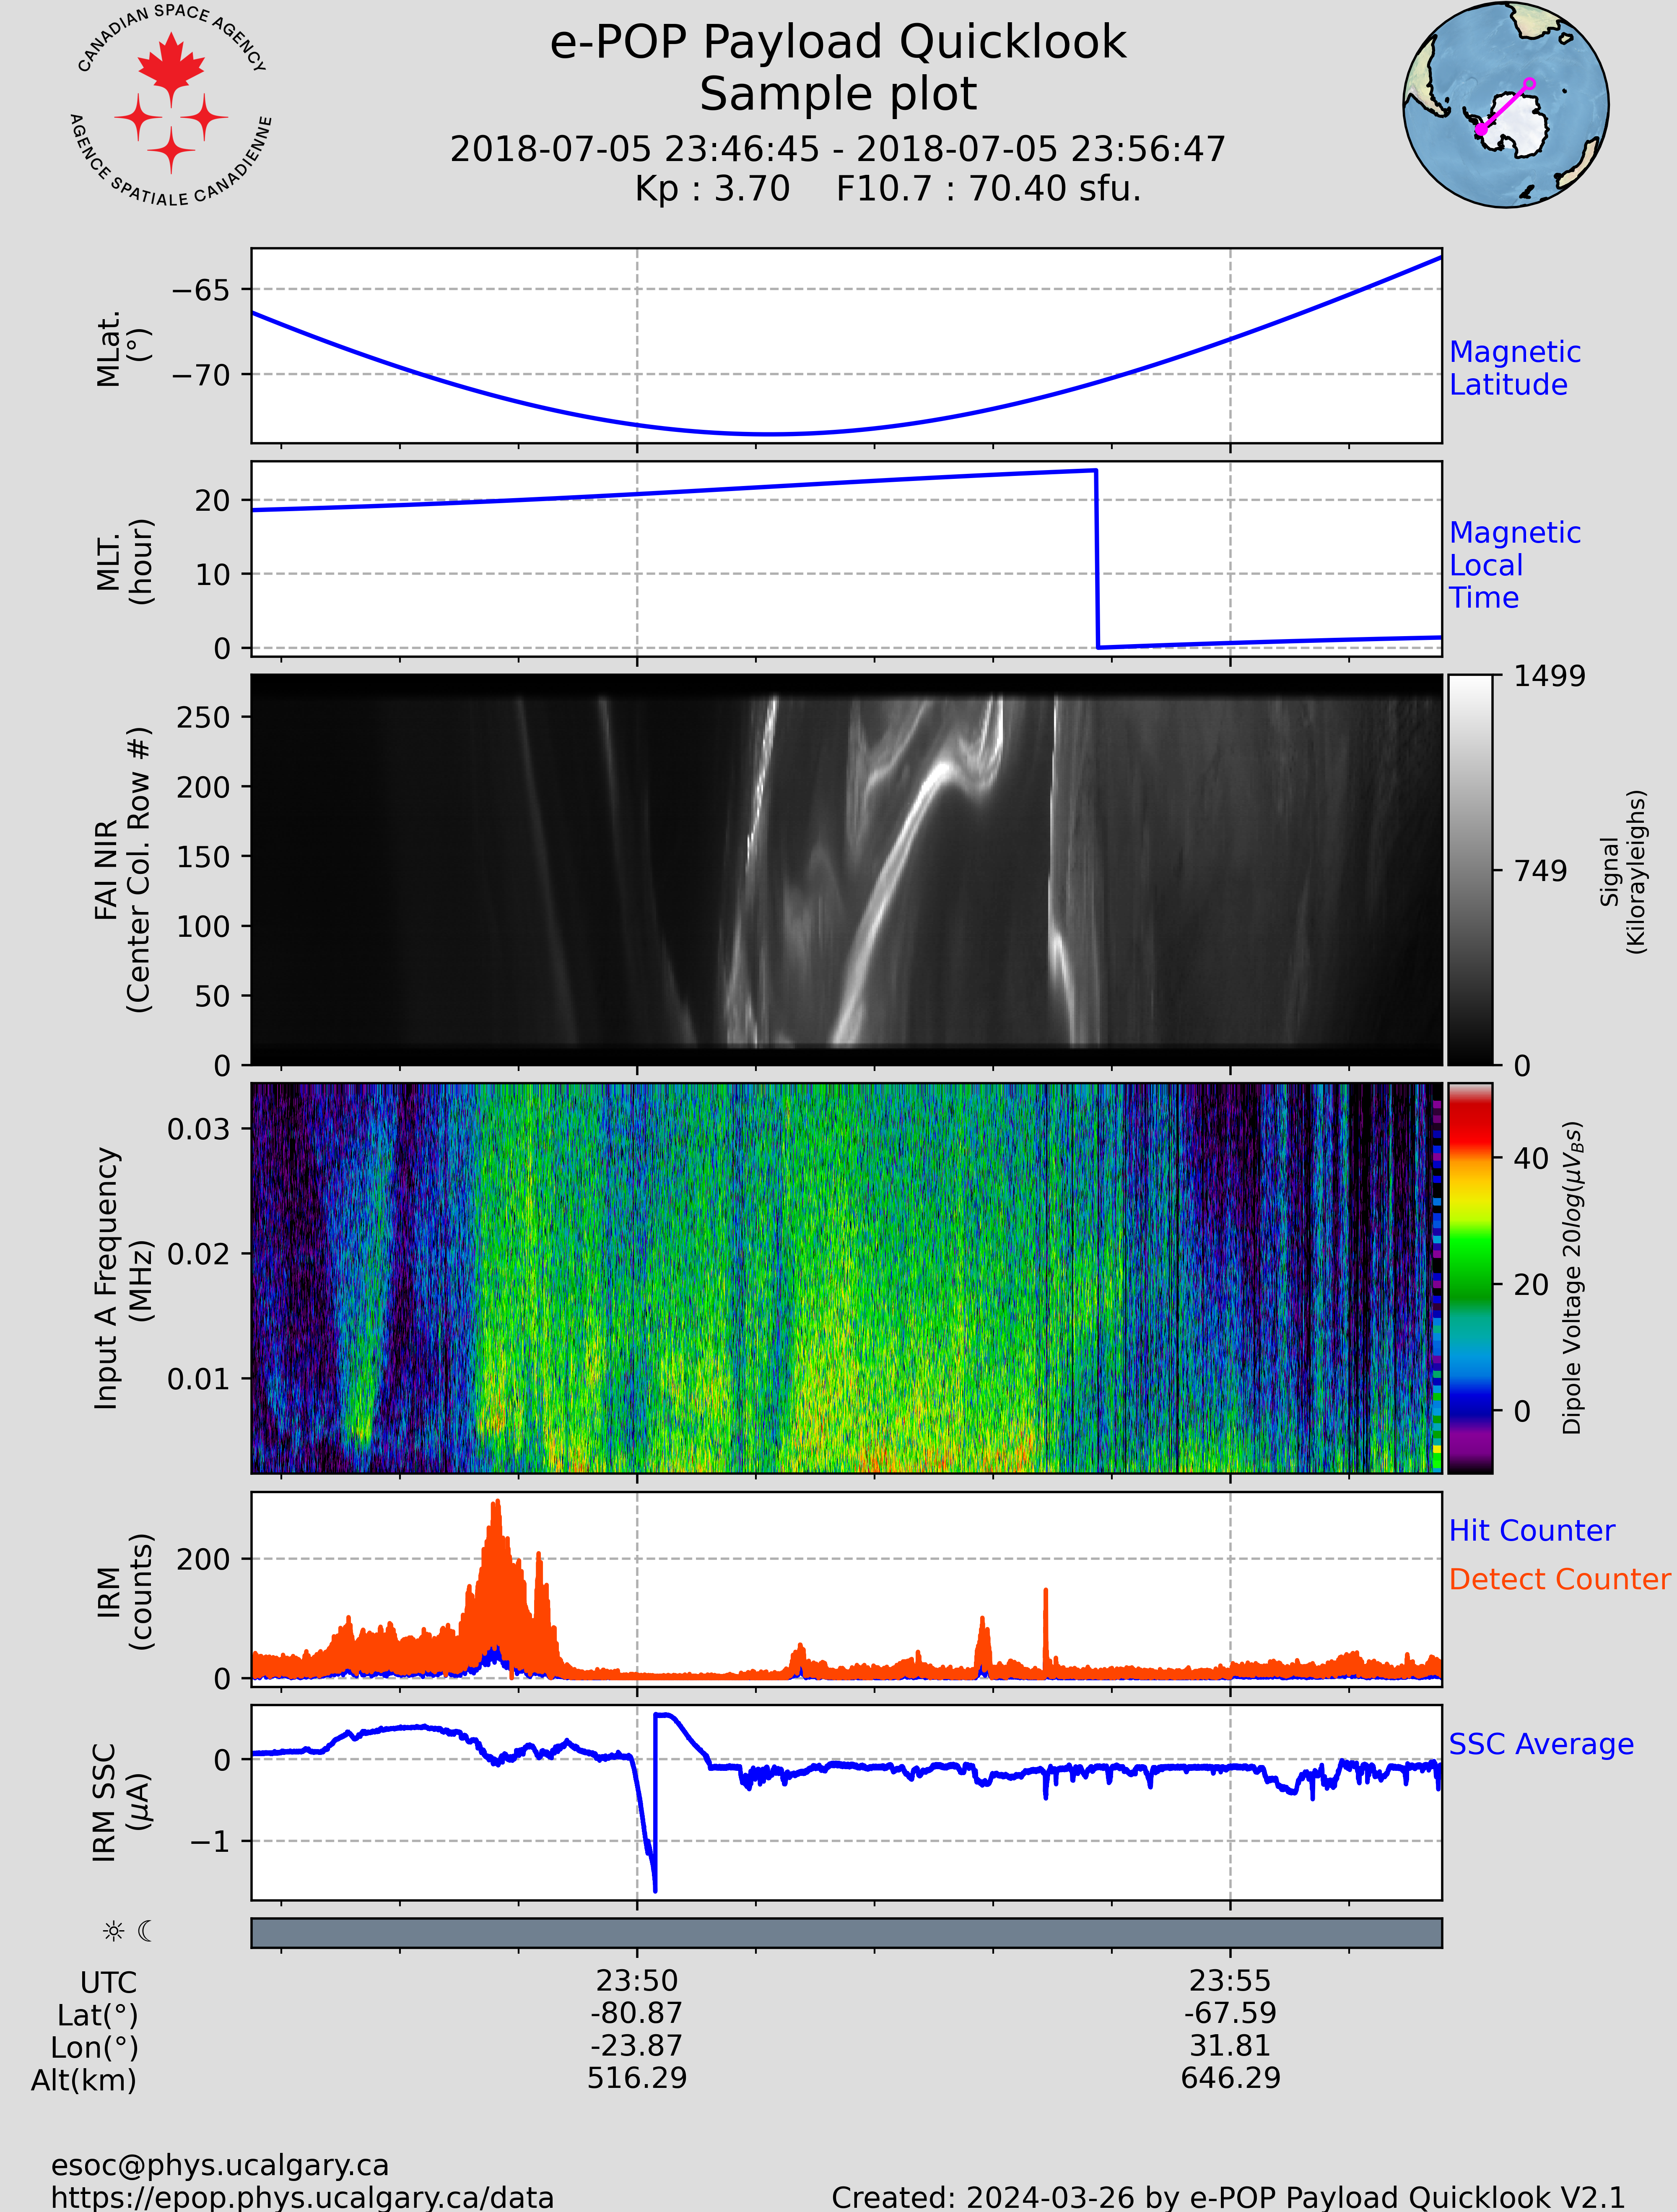
Output Plot Selection
Choose which plots to display in your quicklook:
Order of selection will display top to bottom*
| EPHEMERIS: |
|
||||||||||||||||||||||||||||||||||||||||||||
| TELEMETRY: |
|
||||||||||||||||||||||||||||||||||||||||||||
| IRM: |
|
||||||||||||||||||||||||||||||||||||||||||||
| FAI: |
|
||||||||||||||||||||||||||||||||||||||||||||
| MGF: |
RRI: |
|
GAP: |
|
*eclipse always displayed at the bottom Date Range (UTC)A time range of 10 minutes is typical.
Start Date
End Date
SubtitleOptionsBackground Colour:File type:DPI:*Note: Most outputs take approximately 30 seconds to generate. 
|
